Figma: The Stock the AI Trade Left for Dead
Figma trades 80 percent below its first day close while revenue growth is accelerating. What the SEC filings show, and why the AI fear may be the setup.
Educational content only. Nothing on this page is financial or investment advice. Full disclaimer

If you want a single stock that embodies the software vs. AI de-rating I wrote about in my last piece on the sector, Figma ($FIG) is it. The company priced its IPO at $33 in July 2025, closed its first session above $115, and has done almost nothing but bleed since. Today it trades around $23: roughly 30 percent below the IPO price and about 80 percent below where public investors first bought it.
The narrative that did this is familiar. If AI can generate interfaces from a prompt, why pay a premium multiple for the company that sells design software? It is the same one-liner that de-rated the entire software complex for a year.
My view is that the narrative and the filings have completely diverged. The market is pricing Figma like a business in decline. The 10-K and 10-Qs describe a business that is accelerating, generating cash, and sitting on a fortress balance sheet, with one genuinely ugly line item that I think explains most of the selling. Let me walk through the numbers, the good and the bad, because both matter here.
Revenue: not just growing, accelerating
Start with the top line, because for a "AI is killing this company" story it is doing something strange.
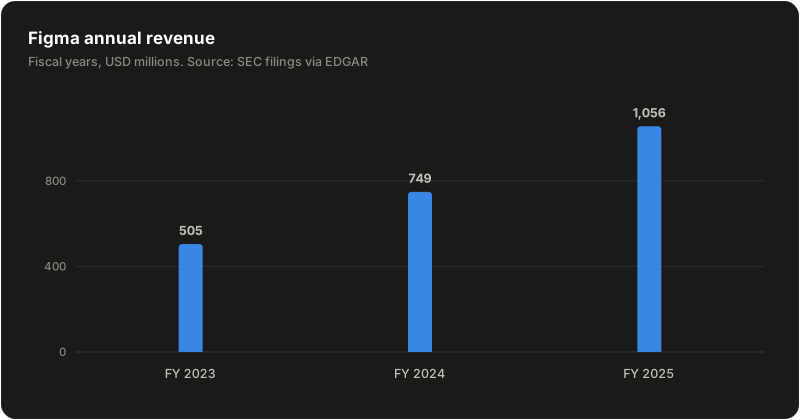
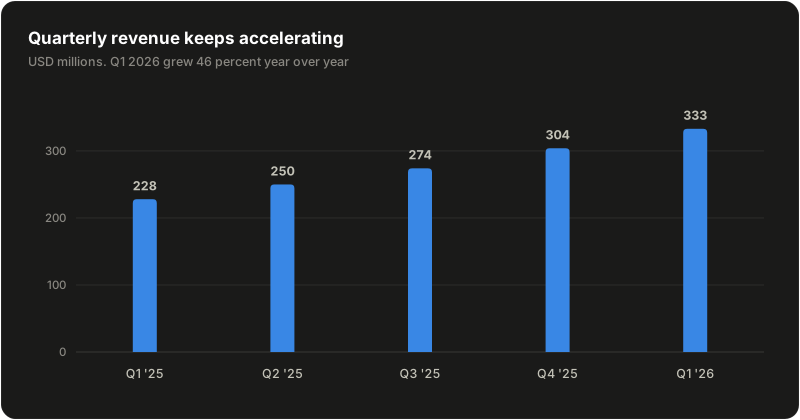
Figma crossed $1B in annual revenue in 2025 after growing 48 percent in 2024 and 41 percent in 2025. Then, instead of decelerating the way every maturing SaaS company is supposed to, it sped back up: quarterly revenue has climbed every single quarter since the IPO, and Q1 2026 grew 46 percent year over year. Growing 46 percent at a $1.3B run rate is elite company: very few public software businesses of this size are compounding that fast. Companies whose product is being commoditized by AI do not print accelerating growth three quarters after going public.
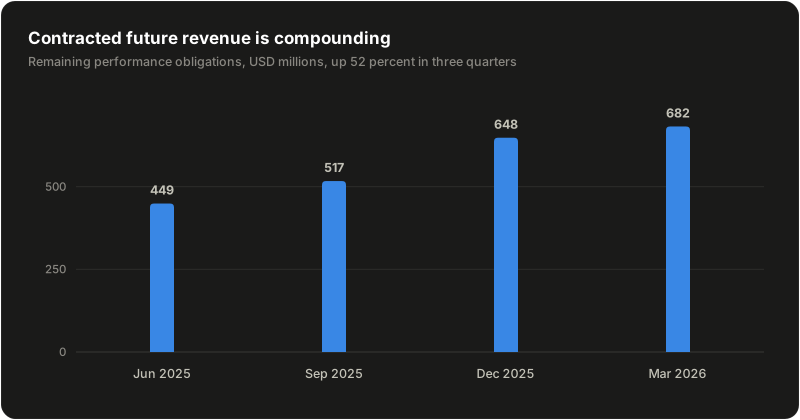
The forward indicator agrees. Remaining performance obligations, the contracted revenue Figma has not yet recognized, grew 52 percent in just three quarters, from $448.8M in June 2025 to $682.3M in March 2026. It is the closest thing the filings give you to a leading indicator of demand. Enterprises are not walking away from Figma. They are signing bigger, longer contracts.
This matches the qualitative picture from the S-1: 95 percent of the Fortune 500 use Figma, and roughly two-thirds of its users are not even designers. This stopped being a design tool a while ago. It is the collaboration layer where software gets decided, and that seat in the workflow is exactly what makes it a distribution channel for AI features rather than a victim of them.
Gross margin: still elite, but the AI bill is real
Here is the first honest negative, and it is worth being precise about it because it is a real trend, not an accounting artifact.
Figma's gross margin is compressing: from 91.2 percent in 2023 down to 79.4 percent in the latest quarter.
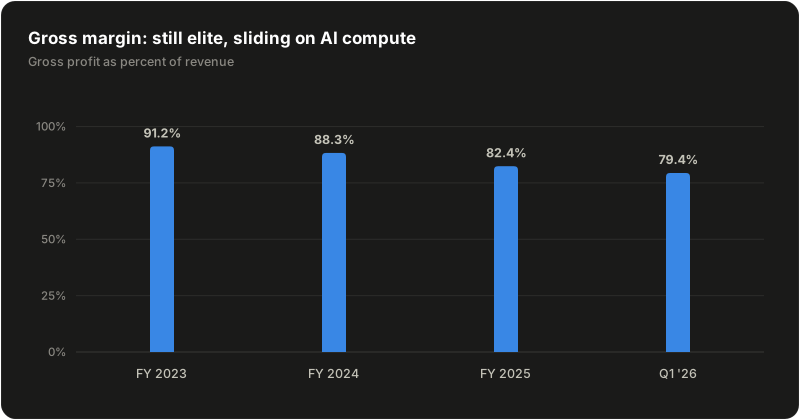
Cost of revenue in Q1 2026 was $68.7M against $19.5M in Q1 2025, more than a tripling in one year. Part of that is stock compensation now flowing through cost of revenue post-IPO, but a meaningful part is compute: Figma is shipping AI features (Figma Make and the rest of the AI suite) and inference is expensive. Every prompt a user runs costs real money in a way that serving a design file never did.
Two ways to read this. The bearish read is margin structure permanently degrading as AI becomes table stakes. The bullish read is that this is the cost of playing offense: Figma is deliberately absorbing AI compute costs to make its product the place where AI-assisted design and prototyping happen, which protects the seat count that everything else is built on. I lean toward the second read, but I want to see this line stabilize near 80 percent rather than keep sliding. In absolute terms, 79 percent gross margin is still a phenomenal business. Most companies would trade their entire cost structure for it.
The income statement: horror movie headline, boring reality
Now the part that screens terribly and explains why quant filters and casual observers hate this stock. The reported bottom line swings from a $737.8M profit in 2023 to a $732.1M loss in 2024 to a $1,250.5M loss in 2025. Taken at face value this looks like a company falling apart. Almost none of it is what it appears to be, and one chart shows why: lay the net income line next to the stock compensation line and the "losses" trace it almost dollar for dollar.
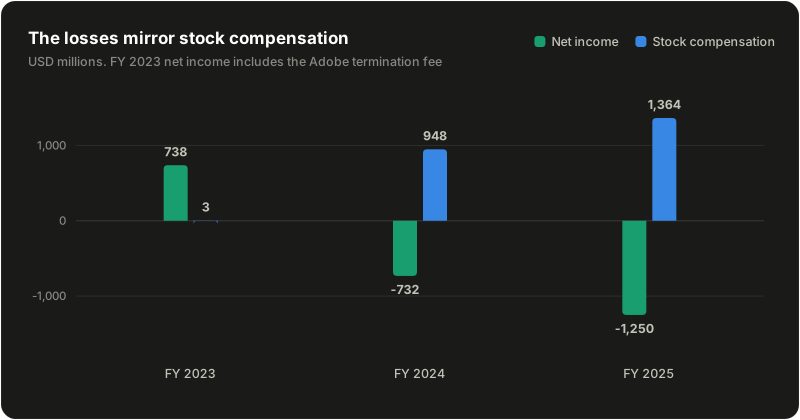
The 2023 profit is not operational: it includes the $1B termination fee Adobe paid when regulators killed the acquisition. Strip it out and 2023 was a modest operating loss of $73.5M.
The 2024 and 2025 losses are stock compensation events, not cash leaving the business. Stock comp expense went from $2.7M in 2023 to $947.6M in 2024 (the May 2024 tender offer that let employees sell after the Adobe deal collapsed) to $1,364.1M in 2025 (the IPO triggering years of accumulated RSU vesting at once). The quarterly pattern proves the point: in the first half of 2025, before the IPO, Figma posted positive operating income of $41.8M. Then Q3 2025, the IPO quarter, absorbed a $1.14B operating loss in a single quarter as the RSU charge hit. Same company, same customers, same product. The loss was the accounting recognition of equity already promised to employees years earlier.
This is almost beat for beat the Circle setup I wrote about in my CRCL thesis: a recently IPO'd company whose GAAP numbers are disfigured by a one-time IPO stock comp charge, screening as broken while the underlying business compounds. The market eventually re-learned how to read Circle. I expect it to re-learn Figma.
Cash flow: the tiebreaker
When the income statement and the story disagree, cash flow is the tiebreaker, because stock comp charges do not touch it.
Figma generated $250.7M of operating cash flow in 2025 against less than $5M of capex, so roughly $246M of free cash flow, a 23 percent margin. In Q1 2026 alone it produced $97.3M of operating cash flow, an annualizing pace near $390M and a free cash flow margin around 27 percent.
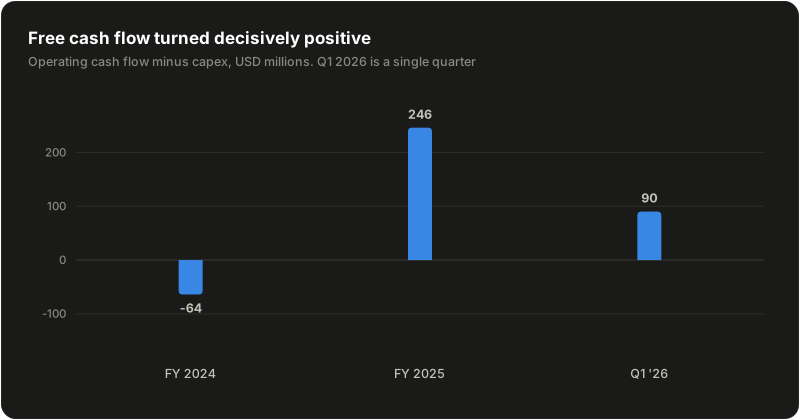
Put the two headline numbers side by side: 46 percent revenue growth plus a 27 percent free cash flow margin gives a Rule of 40 score above 70. That is not a business model in question. That is one of the better growth-plus-profitability profiles in public software, hidden behind a GAAP loss.
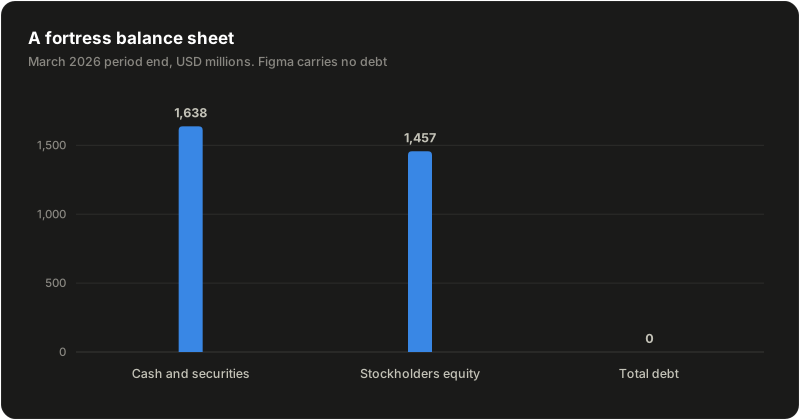
And the balance sheet removes any financing risk from the equation: $1.6B in cash and marketable securities, $1.5B of stockholders equity, and no debt. Figma can fund its AI buildout, absorb the compute costs, and ride out a hostile market for years without raising a dollar.
The real bad: dilution is the price of admission
I said I would be honest about the negatives, and the gross margin slide is not the biggest one. This is: stock compensation is still running at $169M per quarter as of Q1 2026, roughly half of revenue. The one-time charges are behind, but the ongoing run rate is heavy even by software standards, and it lands on shareholders as dilution against roughly 523M shares outstanding.
This is the strongest bear argument on the stock, and I am not going to wave it away. The cash flow is real, but part of it is being handed back to employees in equity. What I want to see over the next four quarters is stock comp falling as a percentage of revenue while growth holds. The post-IPO vesting bulge should decay naturally; if it does not, the quality of the free cash flow deserves a discount. R&D at 52 percent of revenue and G&A at 31 percent (both inflated by that same stock comp) are the other lines to watch for leverage as the company scales.
What you are paying at $23
At $23 the market cap is about $12B. Net of $1.6B in cash, the enterprise value is roughly $10.4B, which is under 8x the current revenue run rate.
For context: on IPO day the market paid north of 50x sales for this exact business, growing slower than it is growing now. Today you pay a multiple in line with mature, mid-teens-growth SaaS for a company compounding at 46 percent with elite gross margins, a 27 percent free cash flow margin, and no debt. The valuation no longer requires believing the AI hype cycle. It only requires believing Figma survives it, and 95 percent of the Fortune 500 quietly re-upping their contracts suggests it will do somewhat better than survive.
The AI risk is real and I do not dismiss it: prompt-to-app tools are improving fast, and some design work will get automated away. But Figma is not positioned as a bystander. It sits on the workflow where humans review, edit, and decide, which is exactly where AI output has to land to become shipped product. The gross margin compression I flagged above is, in a sense, the evidence: the company is spending real money to be the interface to AI rather than its casualty.
The chart: a base trying to form
The price action is where the thesis gets a timing element.
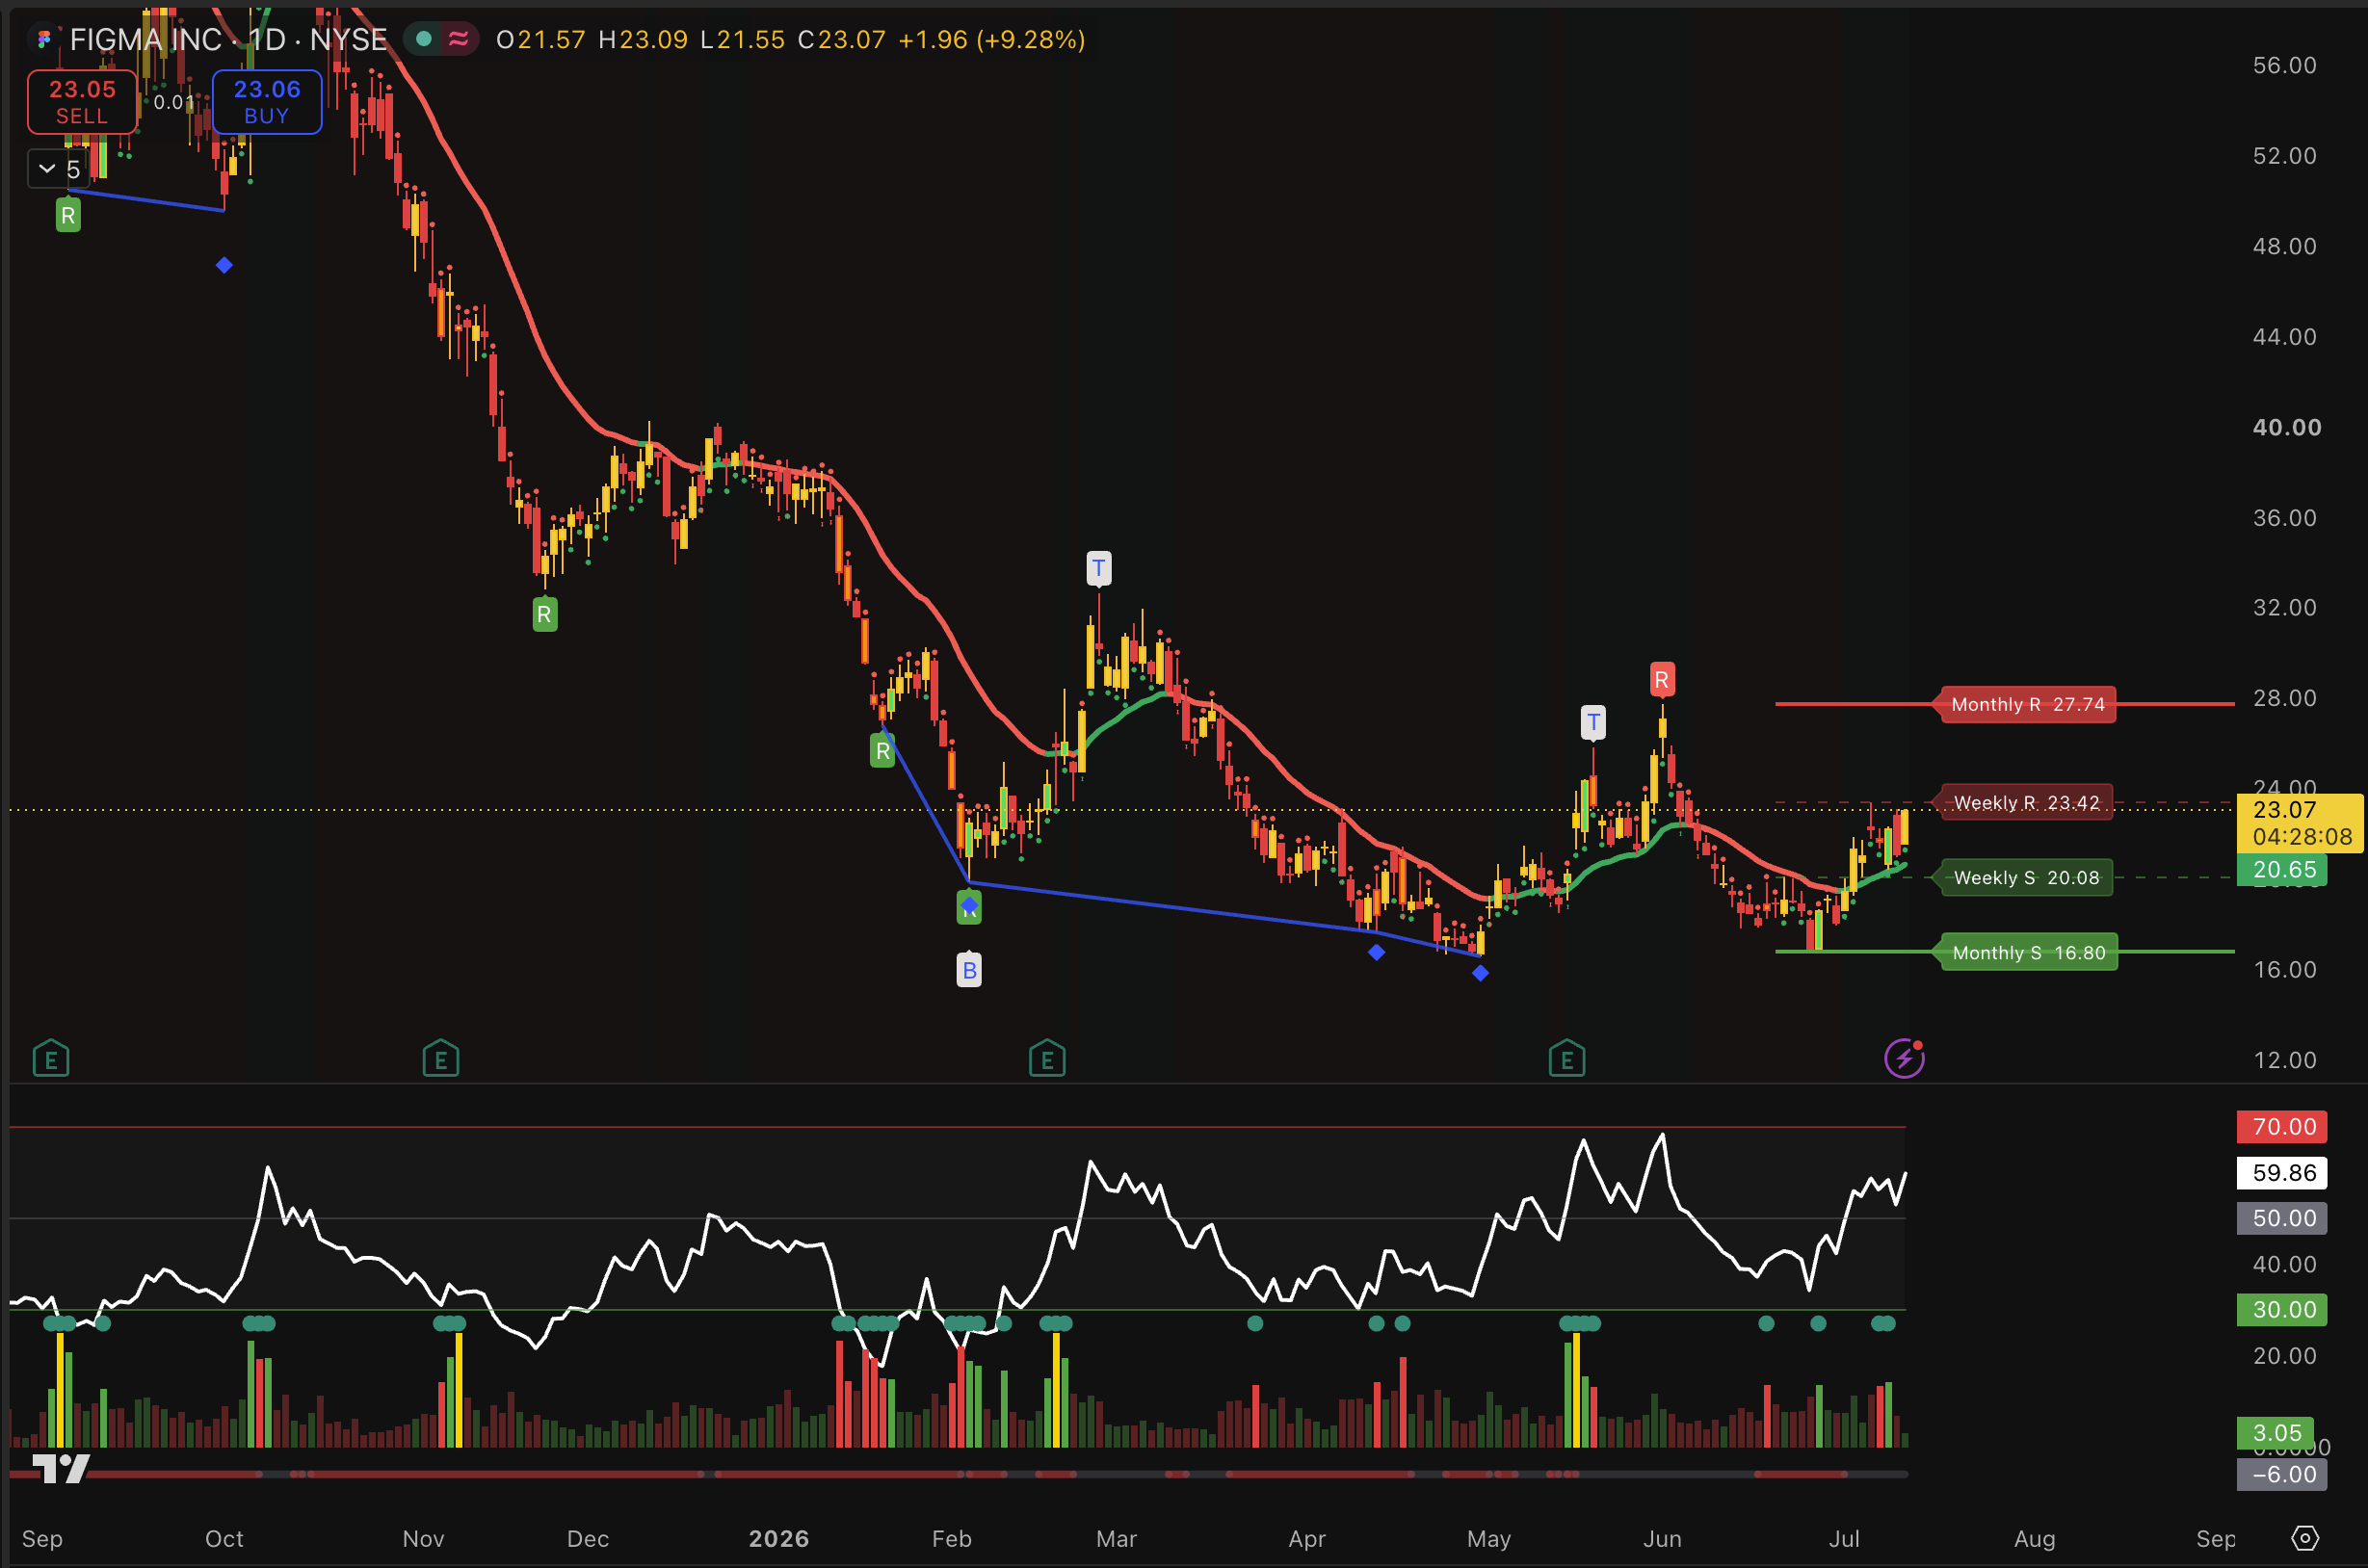
The daily chart tells the story of a stock finishing a long liquidation and trying to turn:
- The downtrend did its damage. From the mid 50s in September the stock ground lower for eight months, bottoming with a double tap of the 16.80 monthly support zone in April and May. That level held twice, and holding a monthly level twice is how bases start.
- The structure has changed since May. Price has printed higher lows off 16.80, reclaimed the weekly support at 20.08, and just closed at 23.07, up 9 percent on the day, pressing directly into weekly resistance at 23.42. RSI sits near 60 with room before overbought: strength, not exhaustion.
- The levels are clean. A decisive reclaim of 23.42 opens the path to the monthly resistance at 27.74, the first real supply zone above. Above that there is a lot of unfilled air from the collapse. Below, the invalidation is just as clear: losing 20 puts the base in question, and losing 16.80 kills the setup entirely.
An eight-month, 60 percent decline into a double bottom at monthly support, with fundamentals accelerating the entire way down, is the kind of divergence between price and business that produces asymmetric entries.
The bottom line
Figma is what it looks like when a narrative de-rates a stock faster than reality can defend it. The filings show accelerating 46 percent growth at a $1.3B run rate, contracted future revenue up 52 percent in three quarters, a 27 percent free cash flow margin, and $1.6B of cash against zero debt. The blemishes are real, gross margin compression from AI compute and heavy ongoing stock comp, but they are the visible costs of a company playing offense, not symptoms of decay.
If the software vs. AI de-rating is genuinely behind us, the biggest winners will be the names that were punished hardest on narrative while their numbers kept compounding. Figma, 80 percent below its first day close with a base forming at monthly support, is at the top of that list.
We track setups like this on higher timeframes across the market. If you want to see how this thesis evolves in real positions, follow the Midas Index.
This article is for educational purposes only and is not financial advice. All financial figures are sourced from Figma's SEC filings (10-K for fiscal 2025 and quarterly 10-Q filings, retrieved via SEC EDGAR).