The URA ETF: Fueling the Next Energy Supercycle
AI datacenters, EV charging, and a decade of underinvestment in uranium mining are colliding at the same time. Why nuclear power and the Global X Uranium ETF ($URA) look like one of the cleanest structural trades in the market.
Educational content only. Nothing on this page is financial or investment advice. Full disclaimer

Every energy transition story of the last decade assumed electricity demand would grow slowly and predictably, and that solar, wind, and batteries could handle the incremental load on their own. That assumption just broke. AI datacenters, EV adoption, and a wave of reshored manufacturing are pushing grid demand higher at a pace utilities have not planned for in fifty years, and intermittent renewables cannot fill that gap alone. Nuclear is the only proven, dispatchable, carbon-free source that can scale to meet it, and nuclear runs on uranium. My view is simple: the market has not finished pricing what that means for uranium demand, and the Global X Uranium ETF ($URA) is one of the cleanest ways to own the trade.
The demand shock nobody priced in
For most of the last twenty years, U.S. electricity demand was flat to slightly down, year after year, as efficiency gains offset population and economic growth. Utilities built their entire planning process around that assumption. That world is over, and the numbers behind it are not subtle. U.S. datacenter electricity demand is on pace to grow from roughly 176 terawatt hours to as much as 580 terawatt hours by 2028, a move that would have sounded absurd on any grid planning document written before the AI buildout started.
Three forces are hitting the grid at the same time. AI datacenters are the biggest and the newest: a single large training or inference cluster can draw as much power as a mid-sized city, and hyperscalers are building dozens of them simultaneously. Electric vehicles are the second: every EV on the road is a new load on the grid that did not exist before, and adoption curves keep bending upward even through periods of slower growth. Reshored manufacturing and broader electrification, from heat pumps to industrial process heat, are the third, quieter driver, adding steady incremental load on top of the other two.
Grid operators and utilities across the country have been revising their multi-year demand forecasts sharply higher, in some cases doubling their prior load-growth assumptions inside a single planning cycle. Survey after survey of institutional investors now shows a majority expecting AI-driven power consumption to become a material, permanent input into nuclear planning over the next decade, not a temporary spike. That is not a rounding error. It is a structural break in a demand curve that was flat for a generation, and it is happening at the exact moment the grid needs new baseload capacity, not just more solar panels.
Why nuclear is the only answer at this scale
Solar and wind are essential parts of the mix, but they are intermittent by nature, and the batteries needed to firm them at grid scale remain expensive and slow to deploy at the gigawatt level datacenters require. Datacenters need power 24 hours a day, 365 days a year, at a reliability standard measured in minutes of downtime per year, not hours. That is a baseload problem, and nuclear is the only carbon-free technology with a multi-decade track record of solving it, running at capacity factors above 90 percent while wind and solar typically run in the 25 to 45 percent range.
Hyperscalers have already reached the same conclusion, and they are putting binding, long-dated contracts behind it rather than press releases. Across the industry, roughly thirteen disclosed hyperscaler nuclear power purchase agreements now add up to about 9.8 gigawatts of committed capacity, the largest wave of private-sector nuclear procurement since the 1970s. Microsoft signed a $16 billion, twenty-year power purchase agreement with Constellation to restart Three Mile Island's Unit 1, an 835-megawatt reactor now rebranded the Crane Clean Energy Center, with first power targeted for 2027, the first commercial nuclear restart in U.S. history. Meta is the single largest cumulative buyer at roughly 6.6 gigawatts, spread across next-generation projects with TerraPower, Oklo, Vistra, and Constellation. Google has signed on with Kairos Power for small modular reactors and with NextEra Energy, on top of a roughly 1.8-gigawatt agreement with developer Elementl Power. Amazon has secured nuclear-adjacent datacenter capacity tied to the Talen Susquehanna plant in Pennsylvania. These are companies with the best demand visibility in the world, locking in nuclear supply a decade or more in advance, which is about as clear a signal as the market gets.
Governments are moving the same direction, and faster than the market seems to appreciate. More than twenty countries pledged at COP28 to triple global nuclear capacity by 2050. In the U.S., a package of executive orders now targets quadrupling domestic nuclear capacity from 100 gigawatts to 400 gigawatts by 2050, backed by real regulatory teeth: a mandate that the NRC issue licensing decisions within 18 months instead of the better part of a decade, a DOE pilot program aimed at reactor criticality at multiple test sites by July 2026, streamlined rules for building reactors on federal land explicitly to power AI datacenters and defense facilities, and a stated goal of ten new large reactors with complete designs under construction by 2030. China continues to bring new reactors online faster than any other country on earth. Japan has been restarting reactors idled since Fukushima. None of this is a niche energy story anymore. It is becoming mainstream industrial policy across the developed and developing world at once.
The supply side has not gotten the memo
Here is the part of the thesis that actually moves prices: none of this new demand can be met with existing uranium supply, and the gap is not narrowing, it is widening.
Global primary uranium production came in around 173 million pounds in 2025, against primary reactor demand of roughly 204 million pounds, a shortfall of about 30 million pounds that has to be plugged with secondary supply: government and utility inventories, recycled material, and enrichment underfeeding. Those secondary sources are finite, and they have been drawn down for over a decade. The World Nuclear Association now projects uranium demand to grow 28 percent by 2030 and more than double by 2040, which means the deficit this thesis is built on is a floor, not a ceiling.
The clearest sign of how tight the physical market already is came directly from the dominant supplier. Kazakhstan's Kazatomprom, which alone accounts for roughly 40 percent of world primary uranium production, just announced it is cutting its own 2026 production guidance by 9 to 10 percent, from 32,777 tonnes down to 29,697 tonnes, a reduction of roughly 8 million pounds, or about 5 percent of global supply. The company was explicit about why: current supply and demand dynamics do not justify running back up to full capacity, even with the long-term contract price holding firm around $80 a pound. That is the single largest uranium producer in the world choosing to hold volume back rather than chase spot strength, which is what pricing power looks like in a tightening physical market, not what it looks like in an oversupplied one.
Spot price action has already started to reflect that tightness. Uranium spot jumped roughly 25 percent in January 2026, breaking above $100 a pound for the first time in two years, before cooling to the mid-$80s by June. Citi has pointed to $100 to $125 a pound as the next range if current trends hold. Layered on top of that, Washington has moved to ban imports of Russian enriched uranium, cutting off a supply chain that historically provided roughly a quarter of the enriched uranium used in U.S. reactors and forcing Western utilities to re-source that material from a smaller pool of alternative suppliers.
New mine supply cannot simply switch on to close any of this. Permitting, licensing, and construction on a new uranium mine routinely takes seven to ten years or more, even before a shovel goes in the ground on a favorable jurisdiction. That means the supply response to today's demand signal is mechanically locked in below what is needed for years to come, almost regardless of price. That is the definition of a structural, not cyclical, deficit.
Why $URA, not a single miner
Owning uranium equities means owning operating leverage: as uranium prices rise, miner margins expand faster than the commodity itself, because a large share of production costs is fixed. That leverage is the appeal, but it comes with single-name risk that a diversified vehicle avoids. Individual miners carry jurisdiction risk (a coup in Niger, an export dispute in Kazakhstan), permitting risk, and execution risk that can hit one stock hard while the underlying uranium thesis stays perfectly intact.
$URA solves that by holding a basket of the sector's key producers and developers across multiple countries and stages of the mine-to-reactor value chain, from established miners to the SMR and reactor-component names riding the same hyperscaler buildout described above, giving broad exposure to rising uranium prices and rising nuclear demand without betting the position on any single company's permit or production report. The fund has roughly $1.53 billion in net assets and has posted a three-year total return above 40 percent through this cycle, and even after the pullback from the highs, consensus analyst coverage remains constructive, with Buy ratings clustered around a weighted upside near 20 percent into year-end and projected earnings growth for the sector north of 40 percent this year. For a thesis built on a multi-year structural deficit rather than a single company's execution, a basket is the more durable way to express the view.
The chart: a structural bull market taking a breather
Zoom out on the daily $URA chart and the multi-year picture is exactly what a structural bull market looks like. From lows near $19 to $20 in the second half of 2024, URA ran in two clean legs, first to roughly $58 by the fall of 2025, then, after a pullback, to a fresh cycle high near $61 to $62 around the turn of the year. That is more than a tripling off the cycle low, and it happened while the demand story above was still being written, not after it was finished.
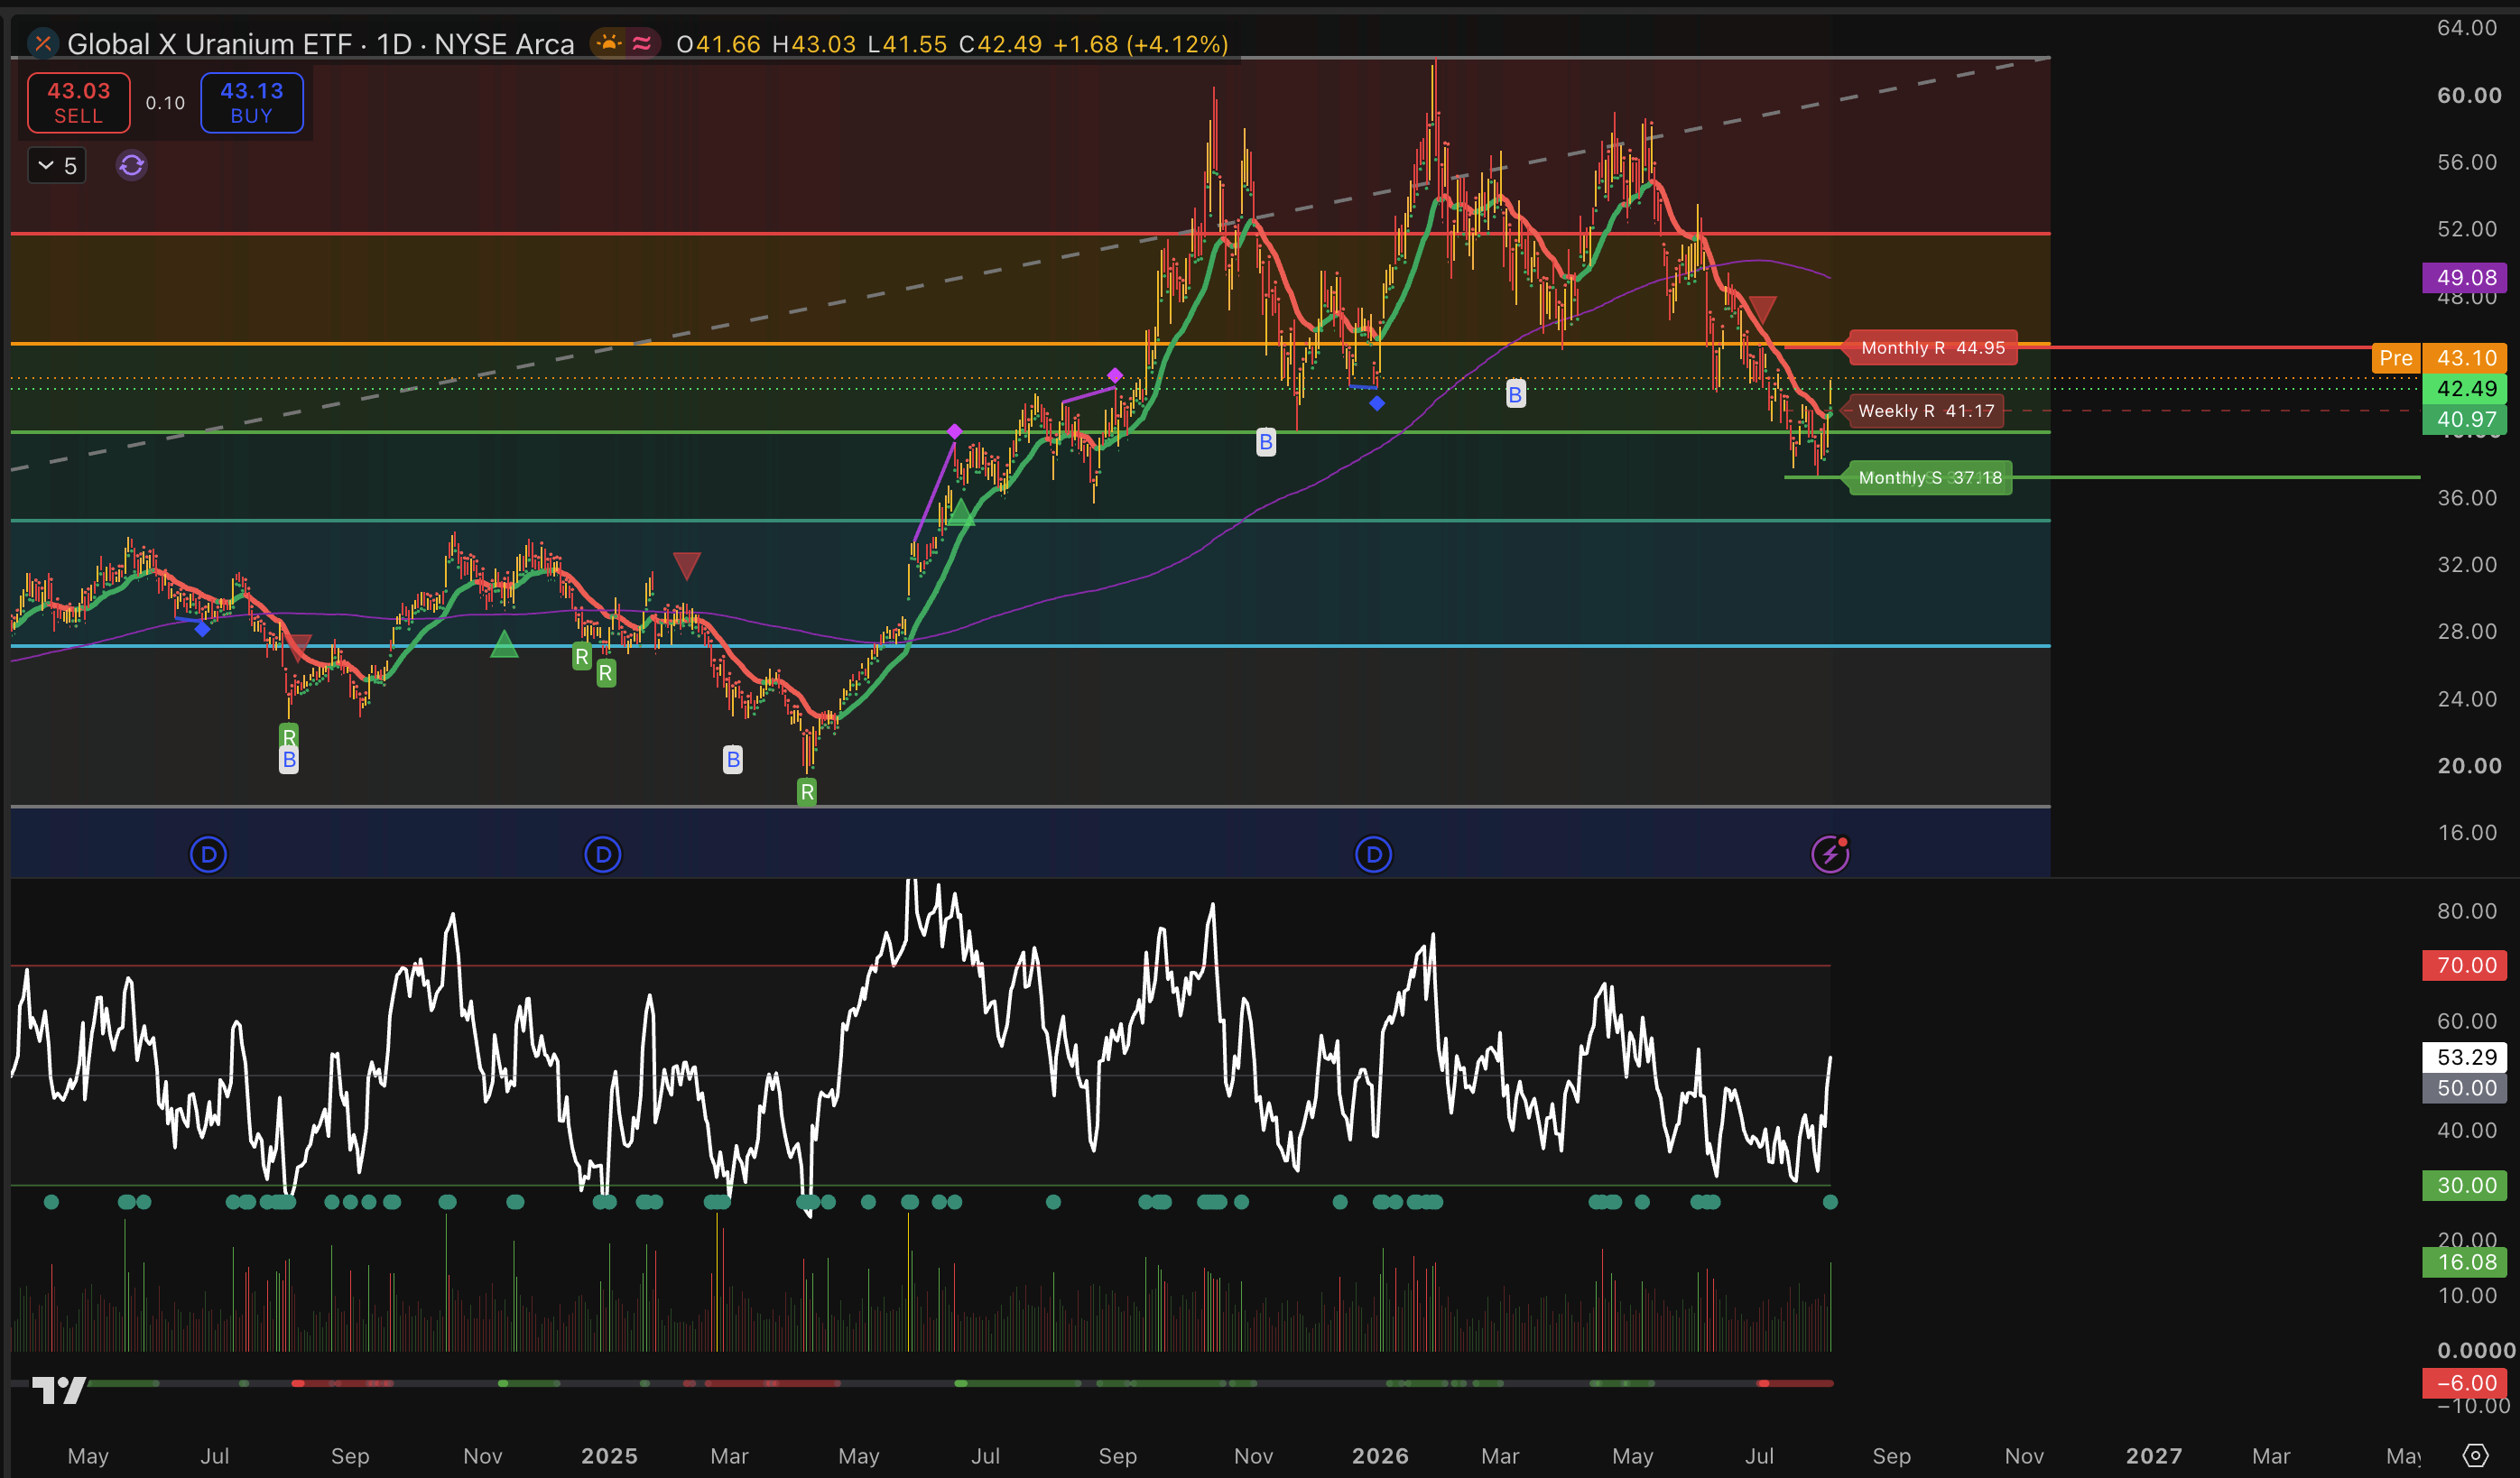
The correction since that high looks orderly, not structurally damaging. The fund was still trading above $50 as recently as early June before the decline extended into the summer, gave back roughly a third of the move from the highs, and found support almost exactly at the monthly support level of 37.18, basing there rather than breaking down further. Today's session is the kind of print you want to see out of that base: URA is up 4.12 percent on the day, trading between a low of 41.55 and a high of 43.03 to close at 42.49, decisively reclaiming weekly resistance at 41.17 in the process. Pre-market indications near 43.10 suggest the move is holding rather than fading. RSI has recovered to 53.29, up from a much more stretched reading during the correction, with plenty of room left before the tape looks overbought again.
The next level that matters is monthly resistance at 44.95. A clean close above it would confirm the correction is over and reopen the path back toward a retest of the $58 to $62 highs. The longer-term ascending trendline connecting the 2024 low is still overhead as well, which is the real structural ceiling to reclaim on a multi-month view, but every higher low this cycle has been bought, and today's reversal candle off major monthly support, arriving in the same window as Kazatomprom's supply cut and firm long-term contract pricing, is another data point in that same pattern. Below, the invalidation level is clear: a decisive break back under 37.18 would say the correction has more work to do. Until that happens, this reads as a healthy, well-defined pullback inside a much larger uptrend, not the end of one.
What would change my mind
- Demand growth disappoints. If AI efficiency gains sharply reduce datacenter power draw per unit of compute, or EV adoption stalls out, or grid-scale storage costs fall fast enough to let renewables handle more of the new load than expected, the demand side of this thesis weakens materially.
- Supply responds faster than the historical lead times suggest. If Kazatomprom reverses course and flexes production back up, major new mines in the Athabasca Basin, Africa, or elsewhere come online ahead of schedule, or utilities and governments release strategic inventories back into the market at scale, the structural deficit narrows faster than the current setup assumes.
- Policy reverses. A serious reactor safety incident anywhere in the world, or a change in government that pulls back the current wave of pro-nuclear policy in the U.S., Europe, or Asia, would stall reactor restarts and new-build commitments and take the wind out of the demand side of the trade.
None of those look like the base case today, but they are the specific things worth watching, because the thesis lives or dies on the supply-demand gap, not on sentiment alone.
The bottom line
Electricity demand just broke out of a fifty-year flat trend, driven by AI datacenters, EV adoption, and electrification arriving all at once, and nuclear is the only proven technology that can meet that new baseload demand at scale. Hyperscalers have already committed roughly 9.8 gigawatts of nuclear capacity to prove it, and governments from Washington to Beijing are backing them with policy. On the other side of that demand curve sits a uranium supply chain running a 30-million-pound annual deficit, watching its largest producer voluntarily cut output rather than chase a firming price, unable to expand on anything shorter than a seven-to-ten-year timeline, and just cut off from a meaningful slice of Russian-sourced material. That combination, a structurally rising demand curve meeting a structurally inelastic supply curve, is exactly the setup that produces multi-year commodity bull markets. $URA gives diversified exposure to that setup, and the chart shows a market that ran hard, corrected in an orderly way to major support, and is now reversing higher off that level. I think this bull case is still in its early innings.
We track setups like this on higher timeframes across the market. If you want to see how this thesis evolves in real positions, follow the Midas Index.
This article is for educational purposes only and is not financial advice.